What are the key differences between Media Stats and ESP Analytics?
ESP Analytics™ is a cleaner, more intuitive platform that uses graphs and showcases data in an easily consumable way. Navigating around ESP Analytics is seamless – toggle between reports in moments and export data to share in presentations. Best of all, it’s updated daily!
Why move from Media Stats to ESP Analytics?
Media Stats was limited to static data that wasn’t updated frequently. With daily updates, ESP Analytics allows you to accurately track product activity. We overhauled the platform to be much more user-friendly than its predecessor as well.
What can I find on the main dashboard?
This provides a snapshot of your ESP®, ESP Websites™, and ASI Show® data. The dashboard showcases a bird’s-eye view of ESP Click Activity, Top Products and Show Reports.
When I'm in ESP Advertising, can I see how certain products are performing by product category specifically?
Yes. This is set up for the Pay for Placement ad under the top tab, Details by Month. The data will default and show by search term. From here you can click and see activity by day and continue to manipulate the data to view as you see fit.
When I'm viewing ESP or ESP Websites Advertising click activity details, how is this information displayed?
This is one of the major improvements on the new platform. In ESP Analytics, you can choose which month’s data you want to view, and within the same screen, you can see a summarized view of click activity broken out daily. In Media Stats, this information had to be pulled from two different reports, so here you can view it al in one place.
Are there any intentions to add virtual shows to show reports?
No, not at this time.
How do I log in and get started?
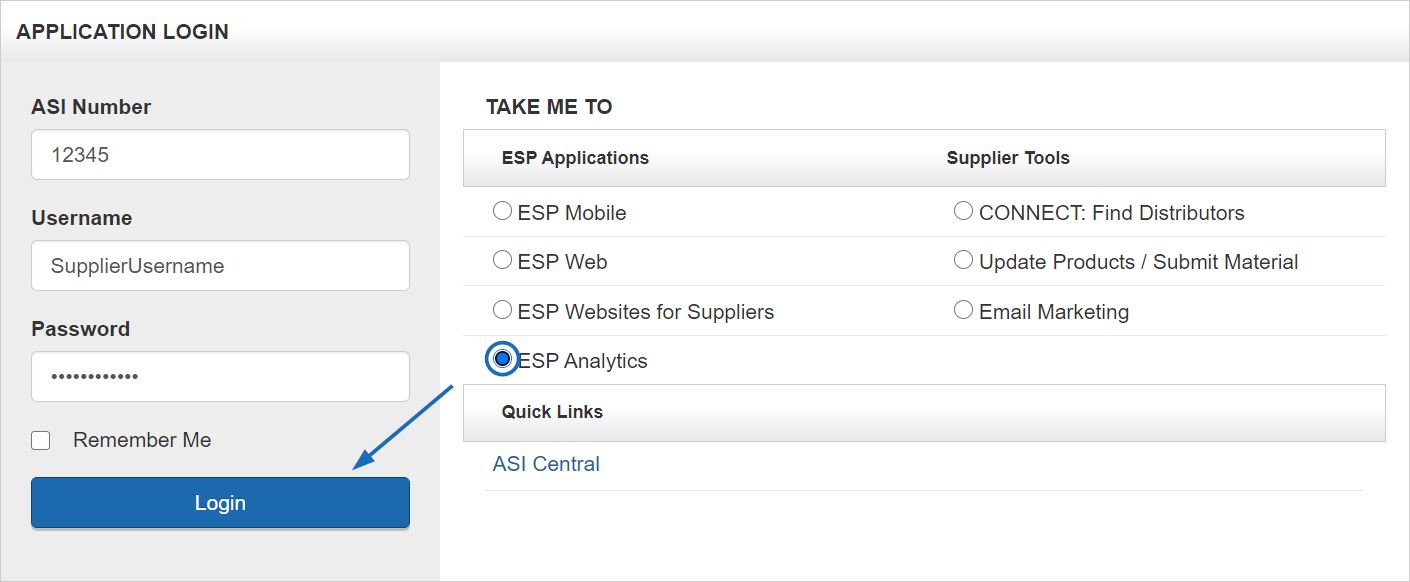
To log in, go to connect.asicentral.com and use your Supplier Single Sign On (SSO) as the log in information. Select ESP Analytics from the options and then click on the Login button.


